87 composable commerce statistics that show the future is composable

Retailers across the globe are rushing to adopt the composable commerce approach to ecommerce architecture and thinking. Discover 87 staggering composable commerce stats that show why composable matters, how it’s grown, and what benefits and challenges retailers are experiencing in the shift to composable. Plus, get insights into top composable commerce trends and discover retailers’ perspectives on the future of composable commerce.
In 2020, Gartner boldly declared “The future of business is composable”.
Just four years later, it seems they were right. 99% of retailers have today either adopted or are planning to adopt a composable approach to commerce.
But what’s driving retailers everywhere to embrace composable commerce? What are the benefits and challenges in the shift to composable? How has composable changed the vendor landscape? And what’s the outlook on composable in the years to come?
The answers to these questions can be hard to find. So we’ve scoured the web for you and gathered 87 of the most impressive, surprising, and important composable commerce statistics.
Get concrete insights from retail decision makers so you can uncover the biggest composable trends, key benefits, top challenges, and the best approaches to choosing composable solutions.
Table of contents
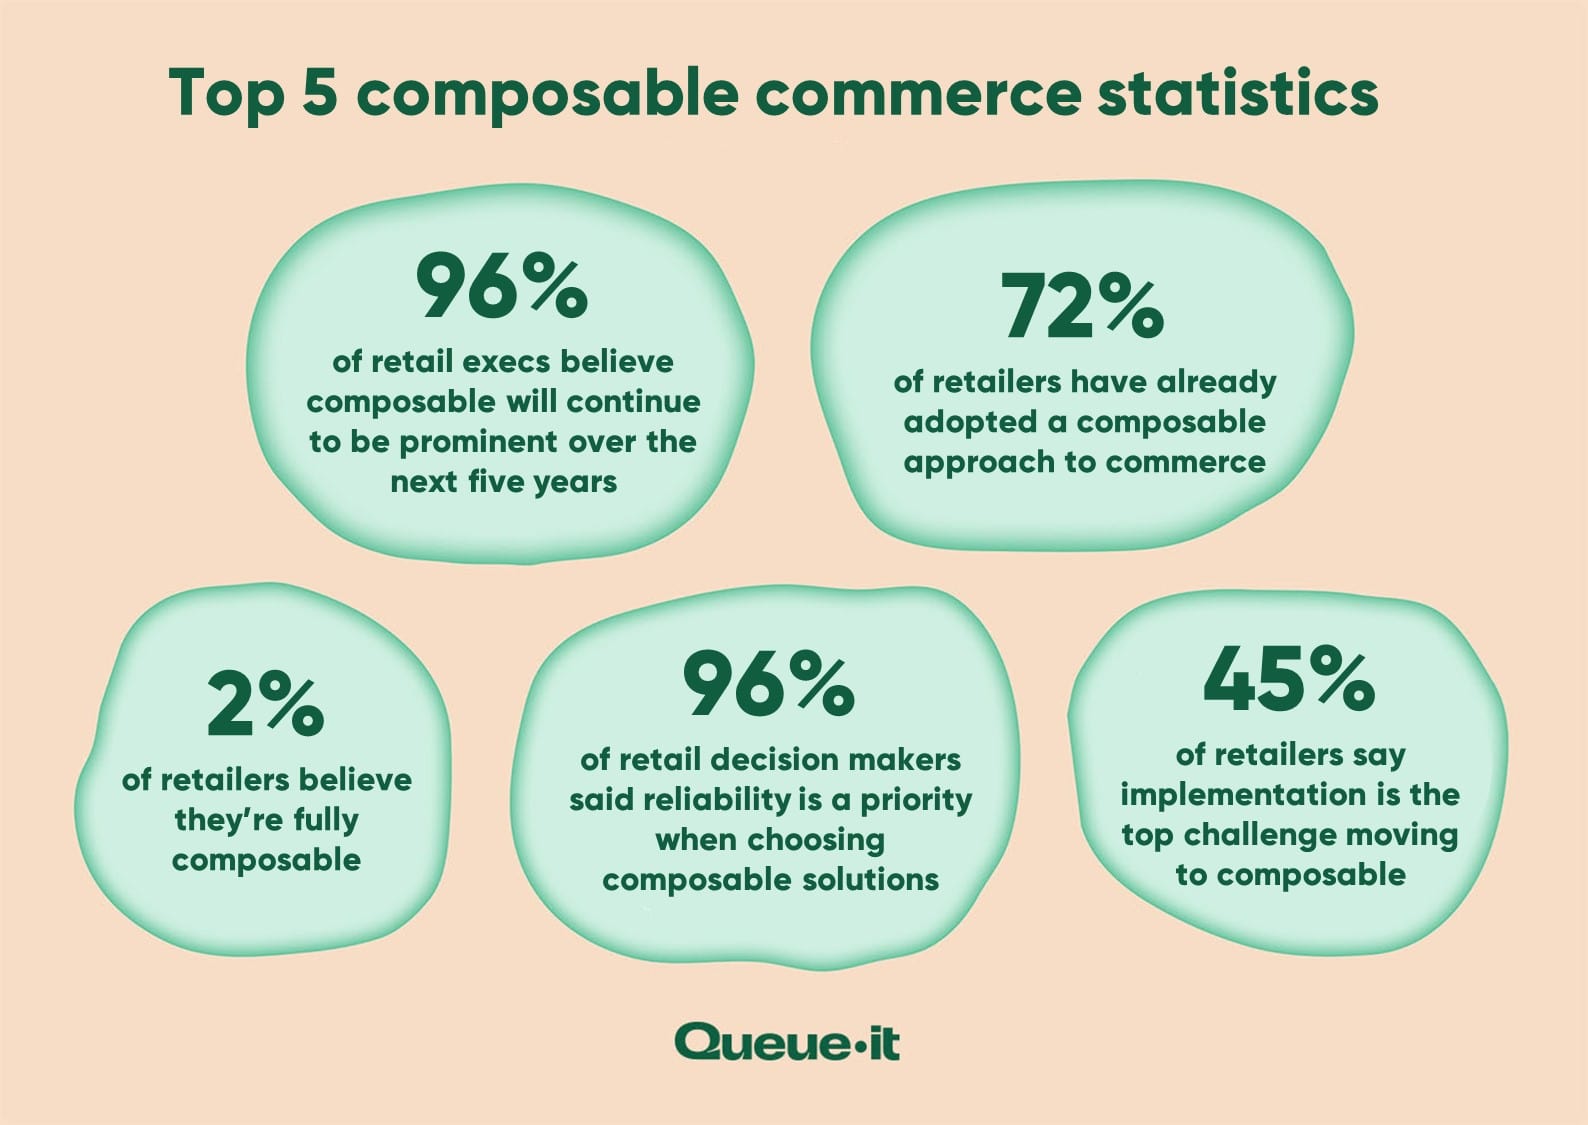
1. 72% of retailers have already adopted a composable approach to ecommerce.
2. 27% are planning to adopt a composable approach, with 21% planning to do so in the next 12 months, 5% in the next two years, and 1% “intending to someday”.
3. Only 2% of retailers claim they are fully composable.
4. 96% of retail execs are either extremely or very familiar with composable commerce.
5. 96% of respondents believe composable commerce will continue to be a prominent tool over the next five years.
6. A mere 4% of retail leaders say they believe composable commerce solutions will be eclipsed by new technological solutions in the next five years.
RELATED: Composable Commerce: Definition, Benefits & Challenges
7. 71% of retail decision makers say their commerce solution strategy is a “high” or “top strategic” priority.
8. 79% of companies plan on increasing investment in MACH tech over the next 12 months.
9. 70% of retail decision makers now prefer and seek composable tooling, up from 44% just two years ago.
10. The “all-in-one” approach is today favored by just 30% of retailers, down from 56% two years ago.
11. The average proportion of organizations’ IT ecosystem which is still legacy is 38%.
12. 89% of retailers reported overall satisfaction with their ecommerce storefronts/front-ends. Among those with headless architecture, this number was 98%.
13. 81% of respondents said they believe their ecommerce front-end improvements are constrained by a lack of development resources.
14. 49% said that lack of development resources was an “extremely” or “very” significant constraint.
The top problems and limitations IT leaders reported with their existing ecommerce platforms are:
- Ease of integration with other solutions: 29%
- Speed of development of new offers, features, and experiences: 28%
- Site performance: 26%
- Product Information Management tools feeding consistent and quality product data and information: 25%
- Supporting multiple digital touch points: 25%
RELATED: Optimize your Website Performance With These 11 Expert Tips
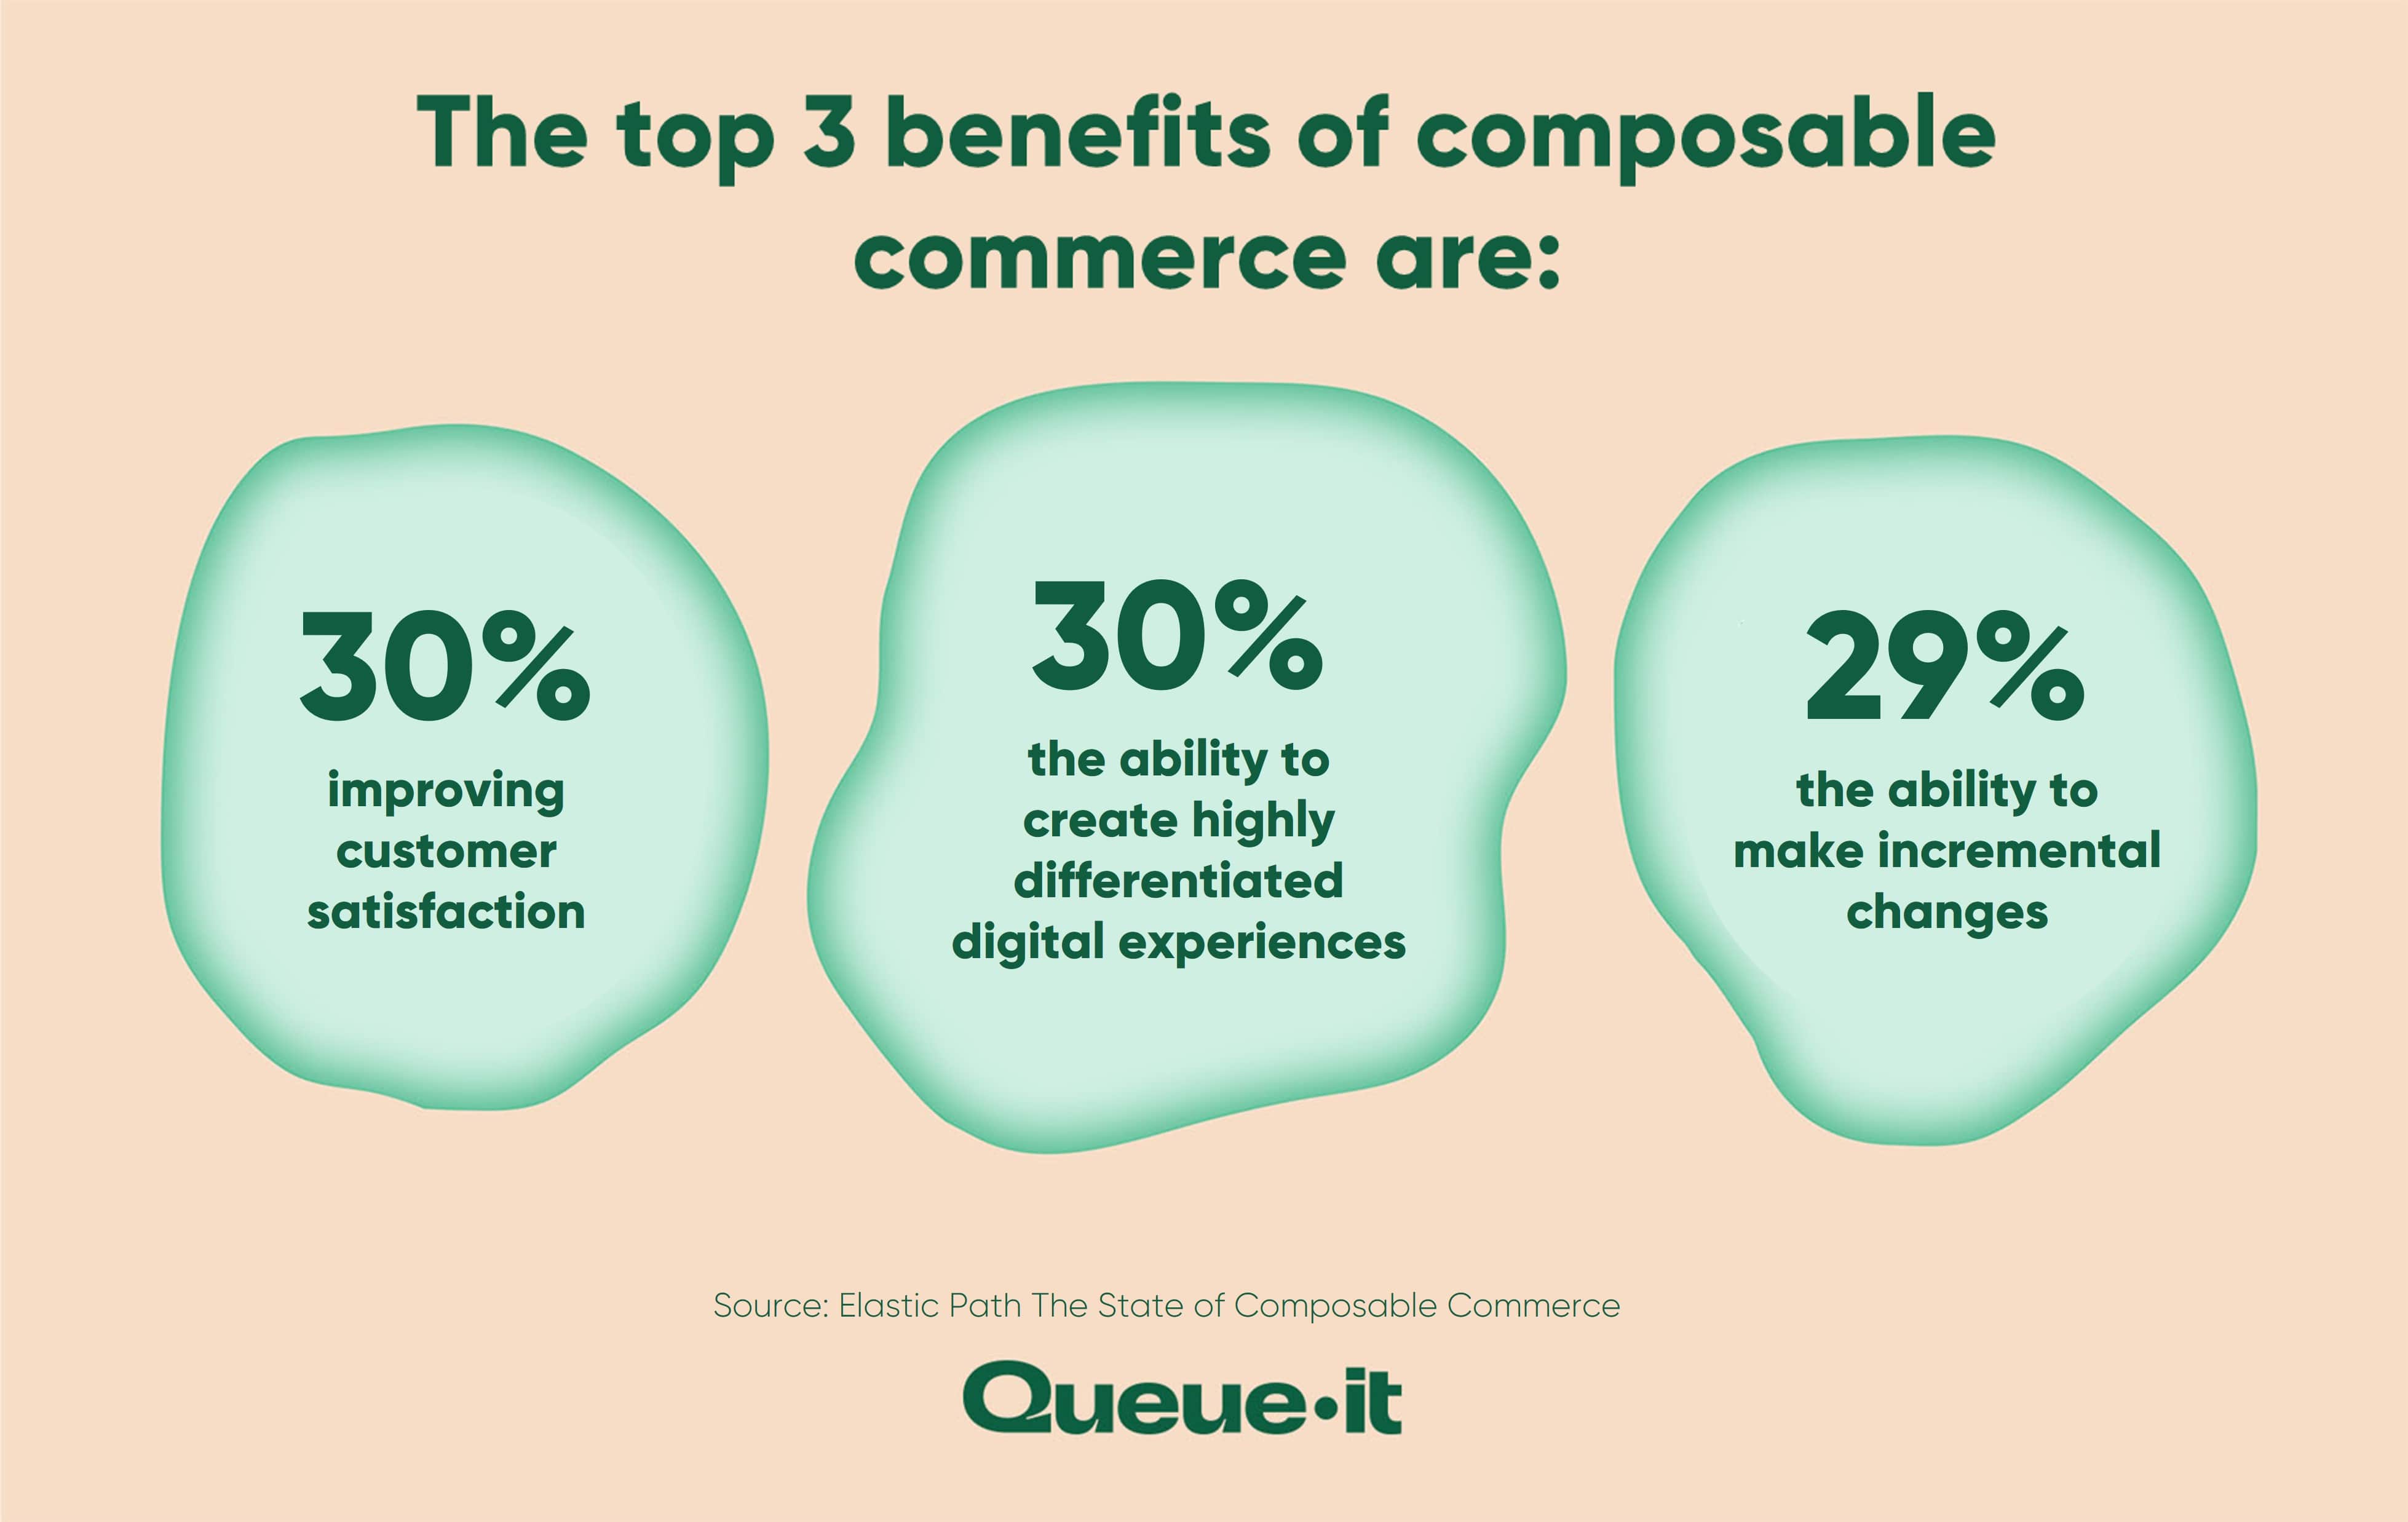
20. 30% of retail executives said composable solutions gave them the ability to create highly differentiated digital experiences.
21. 30% said it improves customer satisfaction.
22. 29% said it gave them the ability to make incremental changes rather than undergoing a complete overhaul.
23. 28% said composable helped create a consistent user experience across touchpoints.
24. 28% said it increased customer engagement.
25. 28% said it increased speed to market for new features or experiences.
26. 27% said it gave them freedom to choose among best-of-breed solutions.
27. And 27% said it reduced the total cost of ownership.
28. 83% of organizations who have implemented a MACH (Microservices, API-first, Cloud-native, Headless) approach to their tech ecosystem have seen ROI.
29. 87% of organizations state that MACH has been very or quite important in helping them meet customer expectations in recent years.
The top reasons retail executives said they’d adopted a composable approach were:
- To increase speed to market: 26%
- To integrate with other technology tools easily: 26%
- To address shifting market and consumer trends quickly: 26%
- To reduce complexity: 24%
- To support multiple business models: 24%
- To provide consistent user experience across touchpoints: 24%
- To facilitate collaboration across teams: 23%
- To support complex go-to-market strategies: 23%
- To create a highly differentiated digital experience for customers: 22%
RELATED: How Rapha Used a Hyped Product Drop To Reward Members & Deliver Fairness
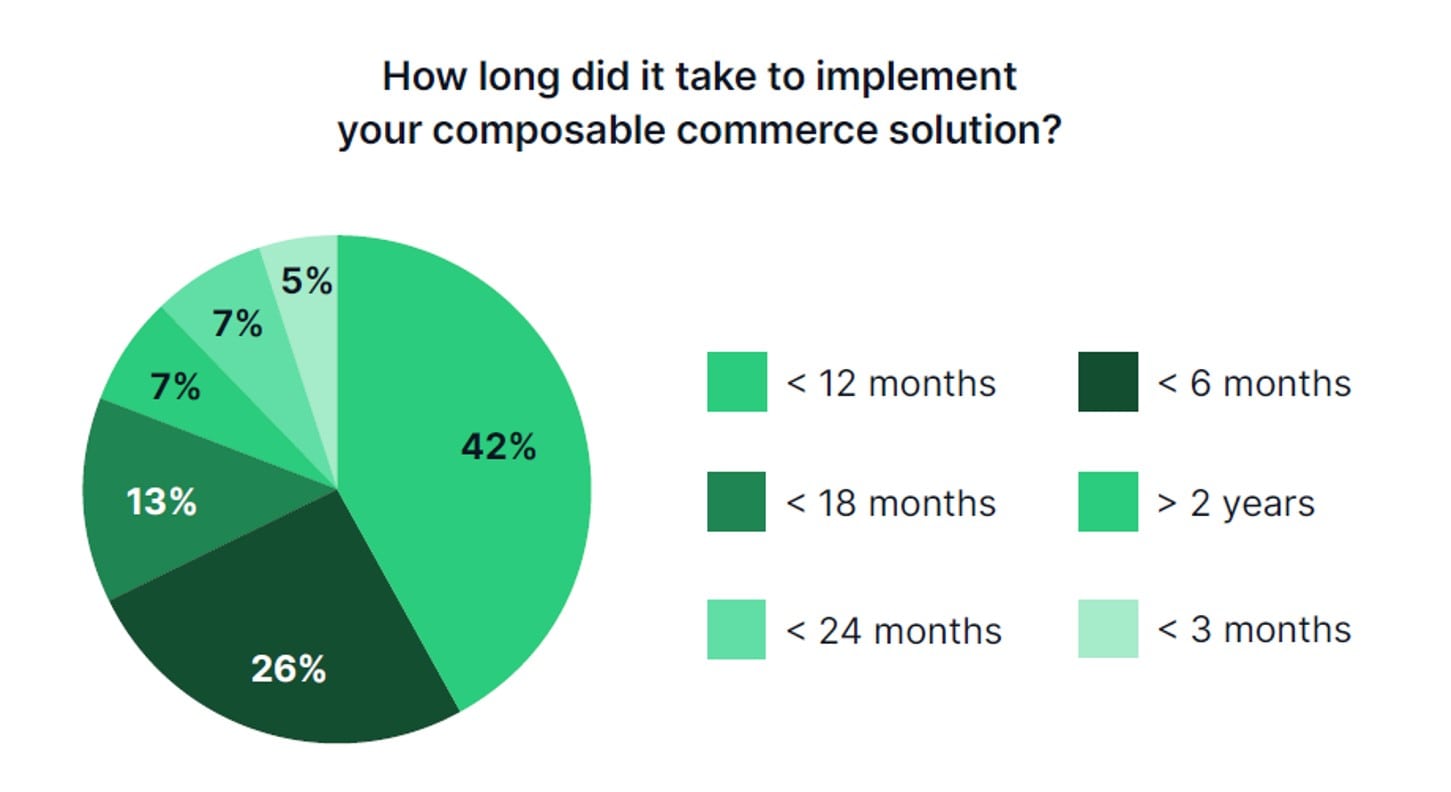
39. Implementing a composable commerce solution took more than six months for 69% of retail execs.
40. 27% experienced an implementation time of over a year.
41. Just 5% said they'd implemented a composable commerce solution in less than three months.
The key challenges faced when implementing composable commerce architecture were:
- It was hard to hire people with the right tech skills: 34%
- Building and managing integrations took a long time: 32%
- Building the front-end was time-consuming: 28%
- Hard to manage vendors: 28%
- My existing tech team did not have the required skills: 27%
- Hard to select vendors: 27%
- Hard to enable team on multi-vendor approach: 26%
- My existing team did not have the bandwidth: 26%
- Paying for multiple vendors was expensive: 25%
RELATED: Why Composable Commerce Won’t Fix Your Scaling Challenges
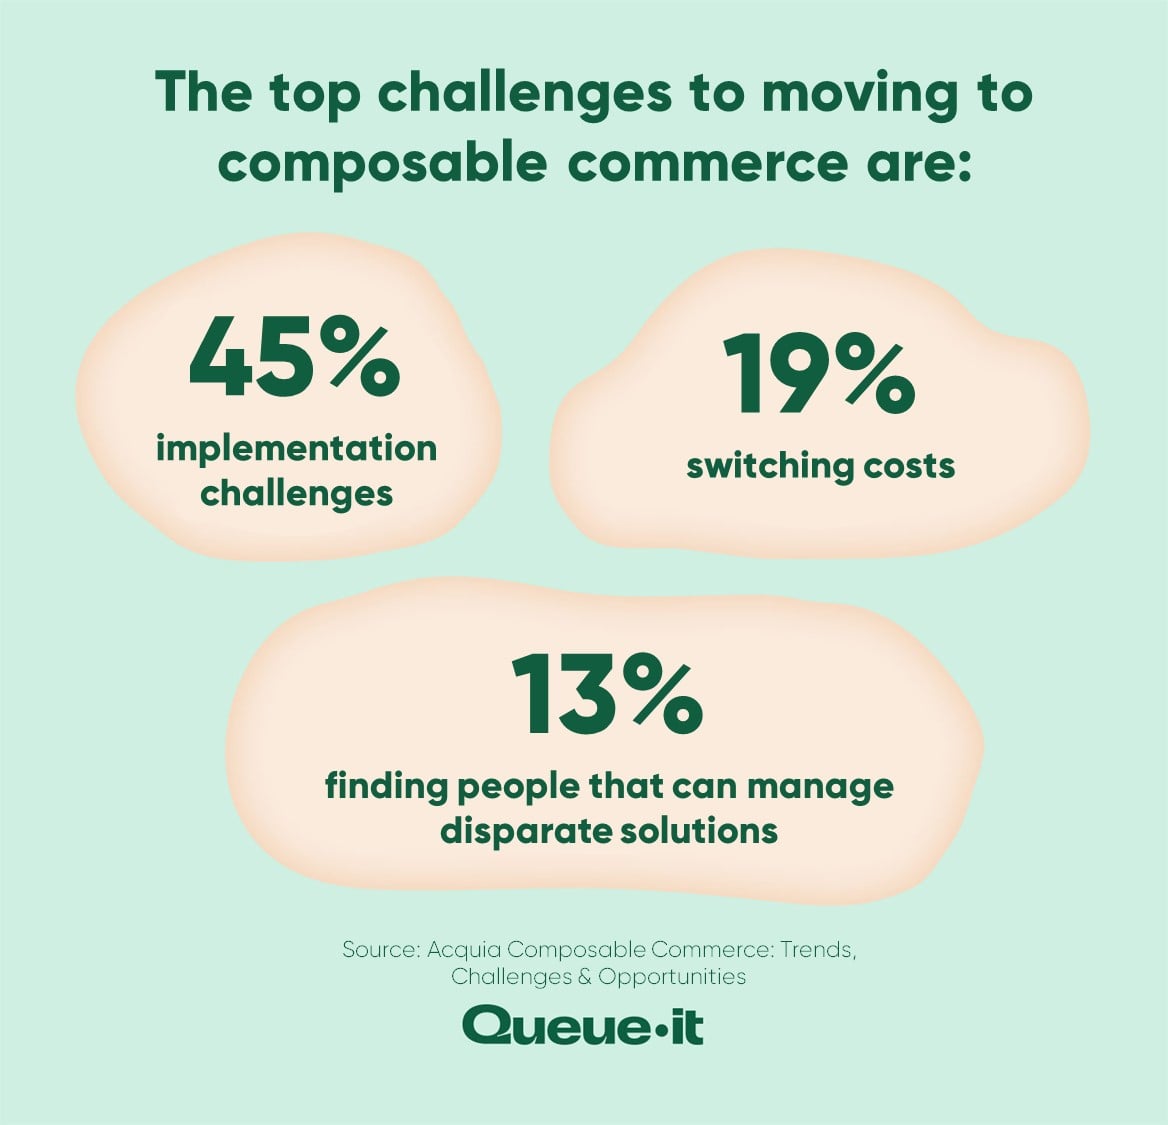
In another survey, retail decision makers said the biggest challenges to moving to a composable commerce framework were:
- Challenges with implementation: 45%
- Switching costs: 19%
- Finding people that can manage disparate solutions: 13%
- Losing cohesion across tools: 12%
- The stickiness of a prior solution: 11%
Business that shifted to headless didn’t always experience the benefits they expected. When asked which problems they continue to have that they expected headless commerce to solve, retail decision makers said:
- Compose and automate intelligent experiences based on user behavior/data: 36%
- Product Information Management tools feeding consistent and quality product data and information: 31%
- Site performance: 29%
- Building consistent brand experiences across customer touch points: 29%
- Speed of development of new offers, features and experiences: 27%
- Supporting multiple digital touch points: 27%
- Content delivery network and rendering: 27%
RELATED: 3 Autoscaling Challenges & How To Overcome Them With a Virtual Waiting Room
63. 67% of retailers say they’re ready to deploy next-gen tech via composable commerce.
64. Reliability was the top factor for retail decision makers when choosing between a composable or monolithic solution, with 96% calling reliability a “moderate” or “high” priority.
RELATED: How To Prevent Website Crashes in 10 Simple Steps
65. Scalability and cost of maintenance were the next most important factors, with 91% of respondents calling these a priority.
66. 90% of retail-decision makers said integration with outside systems was a “moderate” or “high” priority when choosing between composable and monolithic solutions.
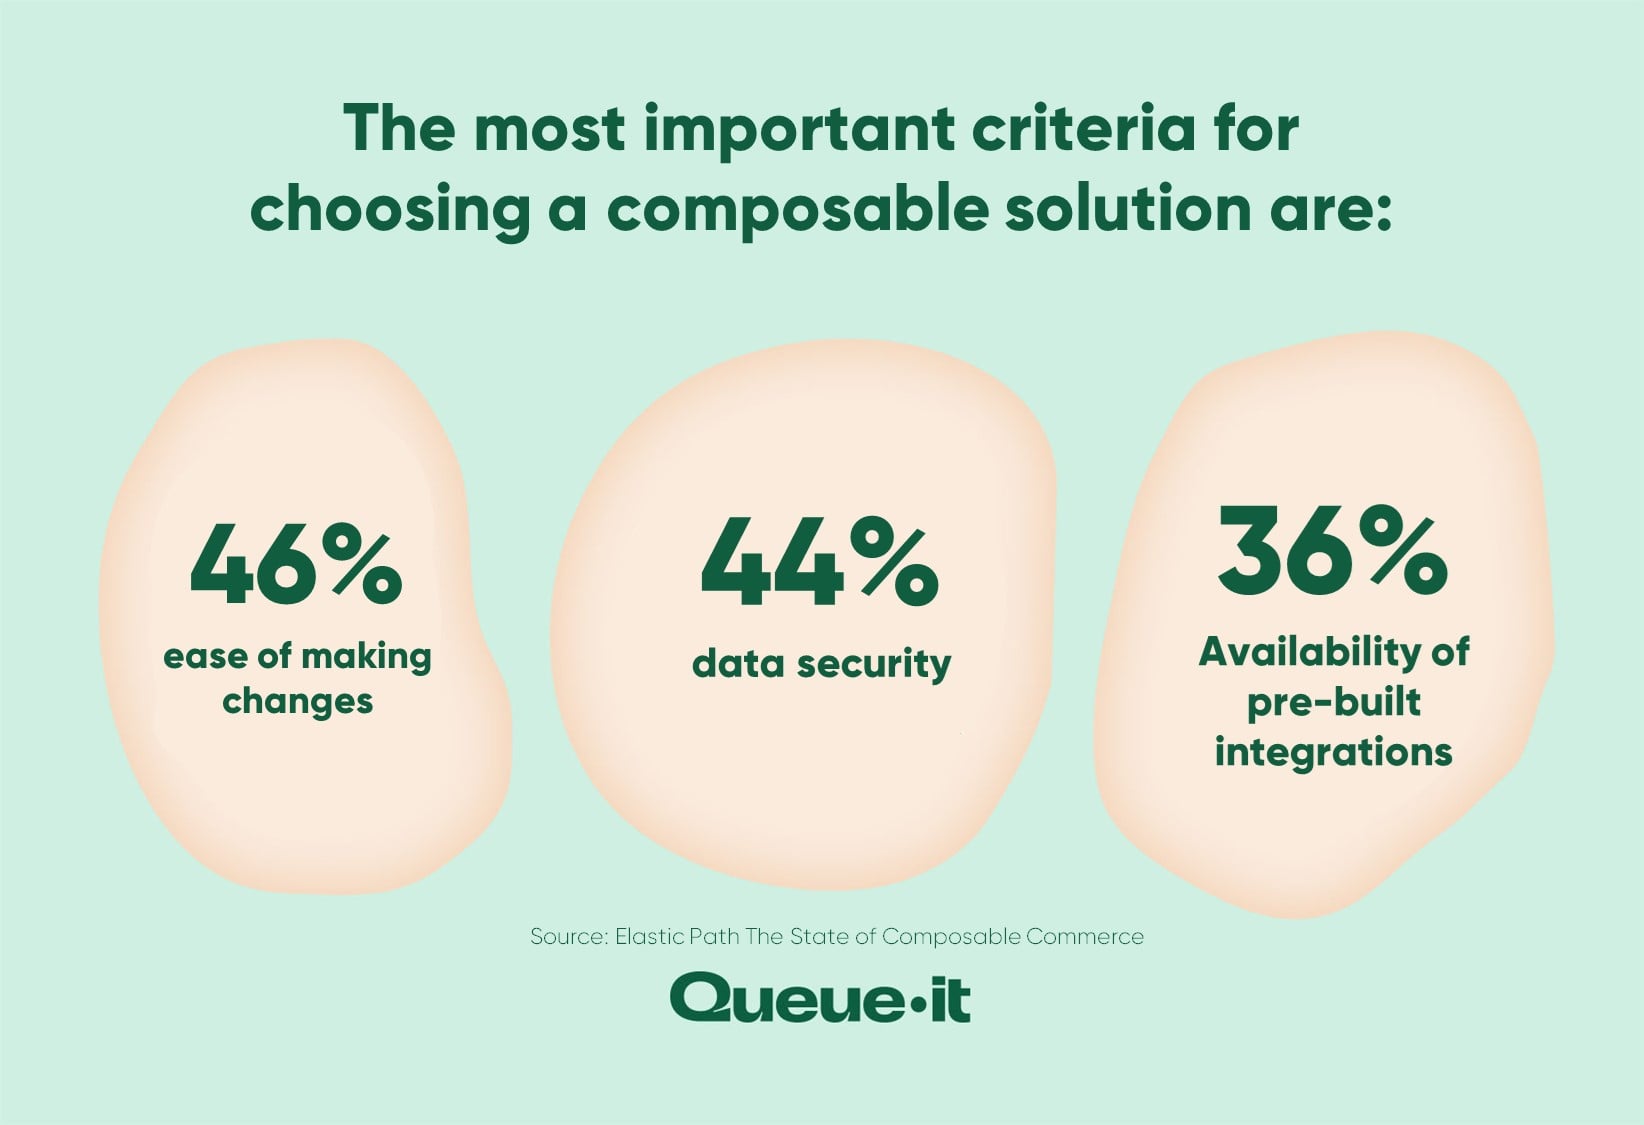
When asked about the most important criteria for choosing a composable solution, retail leaders said:
- Ease of making changes: 46%
- Data security: 44%
- Availability of pre-built integrations: 36%
- Low total cost of ownership of system: 35%
- Centralized support: 33%
- Time to launch: 30%
- Out-of-the-box functionality: 30%
- Underlying architecture: 27%
When asked which tools are currently part of their composable commerce tech stack, retail executives responded:
- Content management systems: 31%
- Enterprise resource planning: 30%
- Customer data platforms: 29%
- Order management systems: 28%
- Digital asset management: 27%
- Product information management: 27%
- Inventory management: 26%
- Personalization: 26%
- Loyalty programs: 22%
- Payment service providers: 21%
- Promotions: 21%
- Ratings/reviews: 21%
- Search: 20%
RELATED: 13 Unique & Successful Loyalty Program Examples
